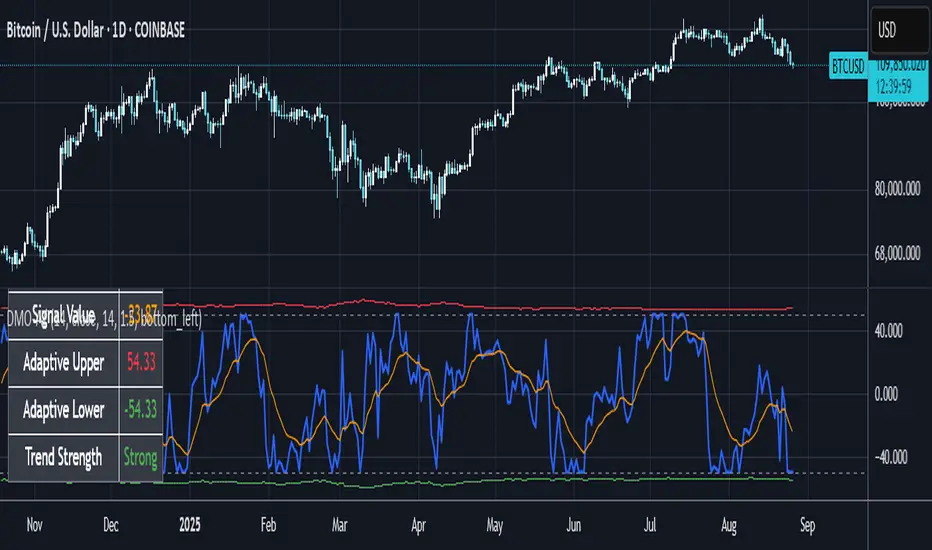
Dynamic Momentum Oscillator with Adaptive ThresholdsDynamic Momentum Oscillator with Adaptive Thresholds (DMO-AT)
This advanced indicator is designed to provide traders with a robust tool for identifying momentum shifts, overbought/oversold conditions, and potential reversals in any market. Unlike traditional oscillators with fixed thresholds, DMO-AT uses adaptive levels that adjust based on current volatility (via ATR) and incorporates volume weighting for more accurate signals in high-volume environments.
#### Key Features:
- **Momentum Calculation**: A normalized momentum value derived from price changes, optionally weighted by volume for enhanced sensitivity.
- **Adaptive Thresholds**: Overbought and oversold levels dynamically adjust using ATR, making the indicator adaptable to volatile or ranging markets.
- **Signal Line**: An EMA of the momentum for crossover signals, helping confirm trend directions.
- **Divergence Detection**: Built-in alerts for bullish and bearish divergences between price and momentum.
- **Visual Enhancements**: Background coloring for quick zone identification, dashed static lines for reference, and a customizable stats table displaying real-time values.
- **Alerts**: Multiple alert conditions for crossovers, zone entries, and divergences to keep you notified without constant chart watching.
#### How to Use:
1. Add the indicator to your chart via TradingView's indicator search.
2. Customize inputs: Adjust the momentum length, source, ATR length, and threshold multiplier to fit your trading style (e.g., shorter lengths for scalping, longer for swing trading).
3. Interpret Signals:
- **Crossover**: Momentum crossing above the signal line suggests bullish momentum; below indicates bearish.
- **Zones**: Entering the overbought (red) zone may signal a potential sell; oversold (green) for buys.
- **Divergences**: Use alerts to spot hidden opportunities where price and momentum disagree.
4. Combine with other tools like moving averages or support/resistance for confluence.
5. Enable the stats table for at-a-glance insights on the chart.
This indicator is versatile across timeframes and assets, from stocks to crypto. It's optimized for clarity and performance, with no repainting.
Search in scripts for "swing trading"
Polynomial Regression HeatmapPolynomial Regression Heatmap – Advanced Trend & Volatility Visualizer
Overview
The Polynomial Regression Heatmap is a sophisticated trading tool designed for traders who require a clear and precise understanding of market trends and volatility. By applying a second-degree polynomial regression to price data, the indicator generates a smooth trend curve, augmented with adaptive volatility bands and a dynamic heatmap. This framework allows users to instantly recognize trend direction, potential reversals, and areas of market strength or weakness, translating complex price action into a visually intuitive map.
Unlike static trend indicators, the Polynomial Regression Heatmap adapts to changing market conditions. Its visual design—including color-coded candles, regression bands, optional polynomial channels, and breakout markers—ensures that price behavior is easy to interpret. This makes it suitable for scalping, swing trading, and longer-term strategies across multiple asset classes.
How It Works
The core of the indicator relies on fitting a second-degree polynomial to a defined lookback period of price data. This regression curve captures the non-linear nature of market movements, revealing the true trajectory of price beyond the distortions of noise or short-term volatility.
Adaptive upper and lower bands are constructed using ATR-based scaling, surrounding the regression line to reflect periods of high and low volatility. When price moves toward or beyond these bands, it signals areas of potential overextension or support/resistance.
The heatmap colors each candle based on its relative position within the bands. Green shades indicate proximity to the upper band, red shades indicate proximity to the lower band, and neutral tones represent mid-range positioning. This continuous gradient visualization provides immediate feedback on trend strength, market balance, and potential turning points.
Optional polynomial channels can be overlaid around the regression curve. These three-line channels are based on regression residuals and a fixed width multiplier, offering additional reference points for analyzing price deviations, trend continuation, and reversion zones.
Signals and Breakouts
The Polynomial Regression Heatmap includes statistical pivot-based signals to highlight actionable price movements:
Buy Signals – A triangular marker appears below the candle when a pivot low occurs below the lower regression band.
Sell Signals – A triangular marker appears above the candle when a pivot high occurs above the upper regression band.
These markers identify significant deviations from the regression curve while accounting for volatility, providing high-quality visual cues for potential entry points.
The indicator ensures clarity by spacing markers vertically using ATR-based calculations, preventing overlap during periods of high volatility. Users can rely on these signals in combination with heatmap intensity and regression slope for contextual confirmation.
Interpretation
Trend Analysis :
The slope of the polynomial regression line represents trend direction. A rising curve indicates bullish bias, a falling curve indicates bearish bias, and a flat curve indicates consolidation.
Steeper slopes suggest stronger momentum, while gradual slopes indicate more moderate trend conditions.
Volatility Assessment :
Band width provides an instant visual measure of market volatility. Narrow bands correspond to low volatility and potential consolidation, whereas wide bands indicate higher volatility and significant price swings.
Heatmap Coloring :
Candle colors visually represent price position within the bands. This allows traders to quickly identify zones of bullish or bearish pressure without performing complex calculations.
Channel Analysis (Optional) :
The polynomial channel defines zones for evaluating potential overextensions or retracements. Price interacting with these lines may suggest areas where mean-reversion or trend continuation is likely.
Breakout Signals :
Buy and Sell markers highlight pivot points relative to the regression and volatility bands. These are statistical signals, not arbitrary triggers, and should be interpreted in context with trend slope, band width, and heatmap intensity.
Strategy Integration
The Polynomial Regression Heatmap supports multiple trading approaches:
Trend Following – Enter trades in the direction of the regression slope while using the heatmap for momentum confirmation.
Pullback Entries – Use breakouts or deviations from the regression bands as low-risk entry points during trend continuation.
Mean Reversion – Price reaching outer channel boundaries can indicate potential reversal or retracement opportunities.
Multi-Timeframe Alignment – Overlay on higher and lower timeframes to filter noise and improve entry timing.
Stop-loss levels can be set just beyond the opposing regression band, while take-profit targets can be informed by the distance between the bands or the curvature of the polynomial line.
Advanced Techniques
For traders seeking greater precision:
Combine the Polynomial Regression Heatmap with volume, momentum, or volatility indicators to validate signals.
Observe the width and slope of the regression bands over time to anticipate expanding or contracting volatility.
Track sequences of breakout signals in conjunction with heatmap intensity for systematic trade management.
Adjusting regression length allows customization for different assets or timeframes, balancing responsiveness and smoothing. The combination of polynomial curve, adaptive bands, heatmap, and optional channels provides a comprehensive statistical framework for informed decision-making.
Inputs and Customization
Regression Length – Determines the number of bars used for polynomial fitting. Shorter lengths increase responsiveness; longer lengths improve smoothing.
Show Bands – Toggle visibility of the ATR-based regression bands.
Show Channel – Enable or disable the polynomial channel overlay.
Color Settings – Customize bullish, bearish, neutral, and accent colors for clarity and visual preference.
All other internal parameters are fixed to ensure consistent statistical behavior and minimize potential misconfiguration.
Why Use Polynomial Regression Heatmap
The Polynomial Regression Heatmap transforms complex price action into a clear, actionable visual framework. By combining non-linear trend mapping, adaptive volatility bands, heatmap visualization, and breakout signals, it provides a multi-dimensional perspective that is both quantitative and intuitive.
This indicator allows traders to focus on execution, interpret market structure at a glance, and evaluate trend strength, overextensions, and potential reversals in real time. Its design is compatible with scalping, swing trading, and long-term strategies, providing a robust tool for disciplined, data-driven trading.

MK_OSFT-Multi-Timeframe MA Dashboard & Smart Alerts-v2📊 Multi-Timeframe MA Dashboard & Smart Alerts v2.0
Transform your trading with the ultimate moving average monitoring system that tracks up to 8 different MA configurations across multiple timeframes simultaneously.
🎯 What This Indicator Does
This advanced dashboard eliminates the need to constantly switch between timeframes by displaying all your critical moving averages on a single chart. Whether you're scalping on 5-minute charts or swing trading on daily timeframes, you'll instantly see the big picture.
⭐ Key Features
📈 Multi-Timeframe Moving Averages
Monitor up to **8 different MA configurations** simultaneously
Support for **SMA and EMA** across 6 timeframes (5m, 15m, 1h, 4h, Daily, Weekly)
Each MA fully customizable: length, color, alert settings, and visibility
Smart visual representation with labeled horizontal lines and connecting plots
🚨 Intelligent Alert System
Cross-over/Cross-under alerts for price vs MA interactions
Three alert modes : No alerts, Once only, or Once per bar close
Smart batching system prevents alert spam during volatile periods
Queue management with 3-second delays between alerts for optimal performance
Easy alert reset functionality for "once only" alerts
📊 Real-Time Information Dashboard
Live countdown timers showing time remaining until each timeframe closes
Color-coded progress bars with gradient visualization (green → yellow → orange → red)
Instant cross-over detection with up/down arrow indicators
Price vs MA relationship clearly displayed (above/below coloring)
🎨 Professional Visualization
Anti-overlap technology prevents labels from clustering
Customizable label positioning and sizing options
Drawing order control (larger timeframes first/last)
Connecting lines link current price to MA values
Status line integration for quick value reference
💡 Perfect For
Multi-timeframe traders [/b who need complete market context
Trend followers monitoring key MA levels across timeframes
Breakout traders waiting for price to cross critical moving averages
Risk managers using MAs as dynamic support/resistance levels
Anyone wanting organized, clutter-free MA monitoring
⚙️ Highly Configurable
Moving Average Settings
Individual enable/disable for each of 8 MA slots
Flexible timeframe selection : 5m, 15m, 1h, 4h, Daily, Weekly
MA type choice : SMA or EMA for each configuration
Custom lengths from 1 to any desired period
Color customization for each MA line and label
Alert Management
Per-MA alert configuration : Choose which MAs trigger alerts
Source selection : Current bar vs last confirmed bar calculations
Frequency control : Prevent over-alerting with smart queuing
Reset functionality : Easily reactivate "fired" once-only alerts
Display Options
Table positioning : Top-right, bottom-left, or bottom-right
Label styling : Size, offset, and gap control
Line customization : Width and extension options
Timezone adjustment : Align timestamps with your local time
🔧 Technical Excellence
Optimized performance with efficient array management and single-pass calculations
Real-time vs historical mode handling for accurate backtesting
Memory-efficient label and line management prevents accumulation
Robust error handling and edge case management
Clean, well-documented code following Pine Script best practices
📋 How to Use
Add to chart and configure your desired MA combinations
Set alert preferences for each MA (none/once/per bar)
Create TradingView alert using "Any alert() function calls"
Monitor the dashboard for cross-over signals and timeframe progress
Use the info table to track all MA values and alert statuses at a glance
🎓 Educational Value
This indicator serves as an excellent educational tool for understanding:
Multi-timeframe analysis principles
Moving average confluence and divergence
Alert system design and management
Professional indicator development techniques
---
Transform your trading workflow with this professional-grade multi-timeframe MA monitoring system. No more chart hopping - get the complete moving average picture in one powerful dashboard!
© MK_OSF_TRADING | Pine Script v6 | Mozilla Public License 2.0

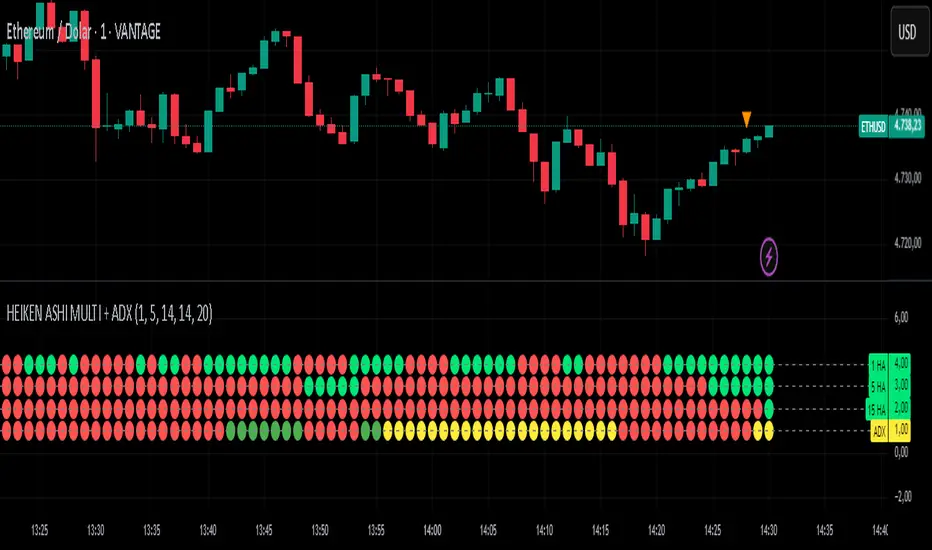
HEIKEN ASHI MULTI + ADXDescription:
This custom indicator combines multiple Heiken Ashi blocks and ADX (Average Directional Index) to provide a comprehensive market analysis tool within a single time frame. It is designed to assist traders in identifying potential buy and sell signals based on Heiken Ashi trends and trend strength.
Key Features:
Multiple Heiken Ashi Blocks:
1-Minute Heiken Ashi: Displays trends in a very short time frame, ideal for scalping strategies.
5-Minute Heiken Ashi: Offers a balanced view for day traders looking for medium-term trends.
15-Minute Heiken Ashi: Provides insights into slightly longer-term trends, helping to confirm signals from shorter time frames.
ADX Functionality:
The ADX line measures the strength of the trend. It helps traders identify whether the market is trending or ranging.
Configurable settings for the ADX period and threshold allow users to tailor this tool to their specific trading style.
Customizable Appearance:
Users can customize the visibility of the Heiken Ashi blocks and ADX plot.
Dot thickness and colors can be adjusted to fit user preferences visually.
Signal Alerts:
Provides alerts when all indicators align (green for buy, red for sell), ensuring traders don't miss significant market opportunities.
Alerts are triggered only on changes to prevent repetitive notifications.
Usage:
Use this indicator for day trading, scalping, or even swing trading strategies by analyzing multiple time frames concurrently.
Customize the settings to suit your trading style for the best results.
How to Use:
Add the indicator to your chart on TradingView.
Configure the settings according to your trading preferences.
Monitor the signals generated by the alignment of the Heiken Ashi blocks and ADX.
Set alerts to be notified of potential trading opportunities based on the indicator's signals.
This indicator is perfect for traders looking for a consolidated view of market trends with a focus on Heiken Ashi candlesticks and trend strength.
Disclaimer:
This indicator is for educational purposes only and should not be construed as financial advice. Always conduct your own research before making trading decisions.
All Weekly Opens + Week LabelThis script plots every Weekly Open (WO) across the entire chart, making it easy for traders to backtest how price reacts to weekly opens historically.
Each weekly open is drawn as a horizontal line and labeled with the month abbreviation and the week number of that month (e.g., WO Aug-4). This allows traders to quickly identify where each weekly session started and analyze market behavior around these key reference levels.
How it works
The script detects the first bar of each new week and records its opening price.
A horizontal line is drawn at that price, extending to the right.
An optional label shows the week name in the format Month-WeekNumber.
Traders can enable or disable labels, change line colors, line width, and optionally display the opening price in the label.
A new input allows filtering to show only the last N months of Weekly Opens. By default, all weekly opens are displayed, but traders can limit the chart to just the most recent ones for a cleaner view.
Why it’s useful
Weekly opens are often respected levels in both intraday and swing trading. They provide natural reference points for:
Backtesting market reactions to session opens.
Identifying areas of support/resistance around weekly levels.
Aligning trade entries and exits with higher-timeframe context.
Simplifying charts by focusing only on the most relevant recent weeks.
Notes
This indicator is not a trading signal generator.
It should be used as a contextual tool for analysis, helping traders improve risk management and entry precision.
Works on all symbols and timeframes.
The “last N months” filter is optional; setting it to 0 will plot all Weekly Opens available in the chart’s history.
NPM Market PredictionMarket Prediction Indicator
The Market Prediction Indicator Script is a custom-built tool designed to give traders a clearer view of market direction and probability. It combines several technical concepts into one framework to help filter out noise, highlight potential opportunities, and improve trade timing.
What it does
Identifies whether the market is more likely trending or ranging.
Generates trade signals only when multiple factors align.
Assigns a confidence score to each signal for added clarity.
Plots guides for stop and target placement that adapt to market conditions.
Filters signals around potential reversal areas to reduce false entries.
What you see
Long/short markers when conditions align.
Confidence score labels for signals.
Adaptive stop/target guides.
Highlighted zones showing potential areas of reaction.
How to use it
1. Observe whether the indicator shows a trending or ranging environment.
2. Take signals when all conditions align and the confidence score meets your threshold.
3. Use the adaptive stop and target guides for risk management.
4. Optionally add higher timeframe confirmation for extra filtering.
Alerts
Long signal confirmed
Short signal confirmed
Target reached
Stop guide breached
Notes
This tool is designed for use across multiple markets and timeframes, from intraday setups to swing trading.
⚠️ Disclaimer: This script is for educational purposes only and not financial advice. Trading involves risk, and you can lose money. Always test on demo and manage risk carefully.

Consecutive Candle Body Expansion with VolumeConsecutive Candle Body Expansion with Volume
This tool is designed to help traders identify moments of strong directional momentum in the market. It highlights potential buy and sell opportunities by combining candlestick behavior with volume confirmation.
✨ Key Features
Detects when the market shows consistent momentum in one direction.
Filters signals with volume confirmation, avoiding low-activity noise.
Highlights possible continuation signals for both bullish and bearish moves.
Works on any asset and any timeframe — from scalping to swing trading.
🛠 How to Use
Green labels suggest potential buying opportunities.
Red labels suggest potential selling opportunities.
Best used in combination with your own risk management rules and other indicators (like support/resistance or moving averages).
⚠️ Note: This is not financial advice. Always backtest before applying in live trading.

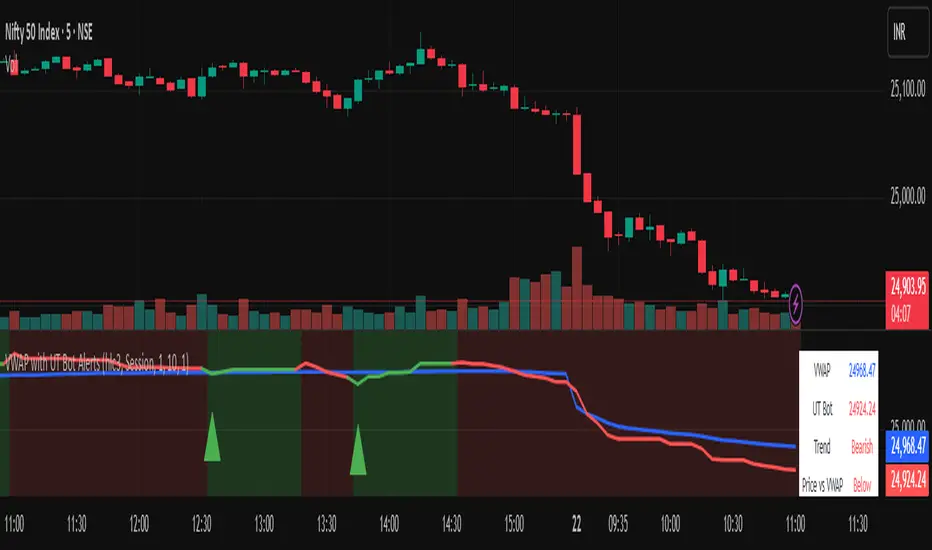
Vwapbot (VWAP + Ut Bot Alerts)Vwapbot (VWAP + Ut Bot Alerts) - Complete Guide
This Pine Script indicator combines two powerful trading tools: Volume Weighted Average Price (VWAP) and the UT Bot trend-following system. Here's a comprehensive breakdown:
What This Indicator Does
The indicator provides:
1. VWAP calculation with deviation bands
2. UT Bot trend signals with trailing stops
3. Combined confluence alerts when both indicators align
4. Visual information table showing current market conditions
Core Components
1. VWAP (Volume Weighted Average Price)
What it is: VWAP calculates the average price weighted by volume, giving more importance to high-volume periods.
Settings:
• VWAP Source: Price used for calculation (default: hlc3 - average of high, low, close)
• VWAP Anchor: Reset period (Session/Week/Month/Quarter/Year)
Usage:
• Price above VWAP = bullish bias
• Price below VWAP = bearish bias
• VWAP acts as dynamic support/resistance
2. VWAP Deviation Bands
What they show: Statistical boundaries around VWAP based on price volatility
Settings:
• Standard Deviation Multiplier: How far the bands extend (default: 1.0)
• Show Bands: Toggle visibility
Usage:
• Gray dashed lines: 1 standard deviation bands (normal price range)
• Red dotted lines: 2 standard deviation bands (extreme price levels)
• Price touching outer bands may indicate reversal opportunities
3. UT Bot (Ultimate Trend Bot)
What it does: Creates a trailing stop system that follows trends and signals reversals
Settings:
• Key Value: Sensitivity multiplier (1.0 = balanced, lower = more sensitive)
• ATR Period: Lookback period for volatility calculation (default: 10)
How it works:
• Uses ATR (Average True Range) to calculate dynamic support/resistance levels
• Green line = uptrend (trailing stop below price)
• Red line = downtrend (trailing stop above price)
4. UT Bot Alerts are integrated to the logic of Volume Profile i,e VWAP, the UT Bot Stop trailing line plot its data and change trends obtaining it's logic from the VWAP and Standard Deviation bands, thus it differs in it's logic of UT Bot alerts from other indicators.
Visual Elements
On-Chart Displays:
1. Blue line: VWAP
2. Gray lines: 1st deviation bands
3. Red lines: 2nd deviation bands
4. Green/Red thick line: UT Bot trailing stop
5. Green triangles up: Buy signals
6. Red triangles down: Sell signals
7. Background color: Light green (bullish) / Light red (bearish)
Information Table (Top Right):
• VWAP: Current VWAP value
• UT Bot: Current trailing stop level
• Trend: Bullish/Bearish status
• Price vs VWAP: Above/Below comparison
• Deviation: Percentage distance from VWAP
• Volume: Current bar volume
Trading Signals
Basic Signals:
1. UT Bot Buy: Green triangle when trend turns bullish
2. UT Bot Sell: Red triangle when trend turns bearish
3. VWAP Cross Above: Price crosses above VWAP
4. VWAP Cross Below: Price crosses below VWAP
Confluence Signals :
1. Bullish Confluence: UT Bot buy signal + Price above VWAP
2. Bearish Confluence: UT Bot sell signal + Price below VWAP
How to Use This Indicator
For Trend Following:
1. Enter long when you get a bullish confluence signal
2. Enter short when you get a bearish confluence signal
3. Exit when the UT Bot trend changes color
For Mean Reversion:
1. Look for reversals when price hits the 2nd deviation bands
2. Confirm with UT Bot signals
3. Target return to VWAP
For Support/Resistance:
1. Use VWAP as dynamic support in uptrends, resistance in downtrends
2. Watch for bounces at deviation bands
3. Confirm direction with UT Bot trend color
Best Practices
Timeframes:
• Intraday: Use Session VWAP anchor
• Swing trading: Use Weekly/Monthly anchors
• Position trading: Use Monthly/Quarterly anchors
Risk Management:
• Stop loss: Below/above the UT Bot trailing stop
• Position sizing: Smaller positions when price is at extreme deviation bands
• Confluence: Wait for both VWAP and UT Bot alignment for strongest signals
Market Conditions:
• Trending markets: Focus on UT Bot signals and VWAP direction bias
• Ranging markets: Use deviation bands for entry/exit points
• High volume periods: VWAP becomes more significant
Alert System
The indicator provides 6 types of alerts:
1. UT Bot buy/sell signals
2. VWAP crossover alerts
3. Confluence alerts (most important)
Set up alerts for confluence signals to catch the highest probability setups when both indicators align.
This indicator works best when combined with proper risk management and used in conjunction with market structure analysis. The confluence signals provide the highest probability entries, while the individual components help with market.
Advice from the publisher:
For using with Indices e.g NIFTY 50, BANKNIFTY etc. use parameters:
UT BOT Key Value : 1
UT BOT ATR Period : 10
Standard Deviation Multiplier : 1 {Default}
For using with commodities e.g NATURALGAS, CRUDEOIL etc. use parameters:
UT BOT Key Value : 2
UT BOT ATR Period : 7
Standard Deviation Multiplier : 1 {Default}
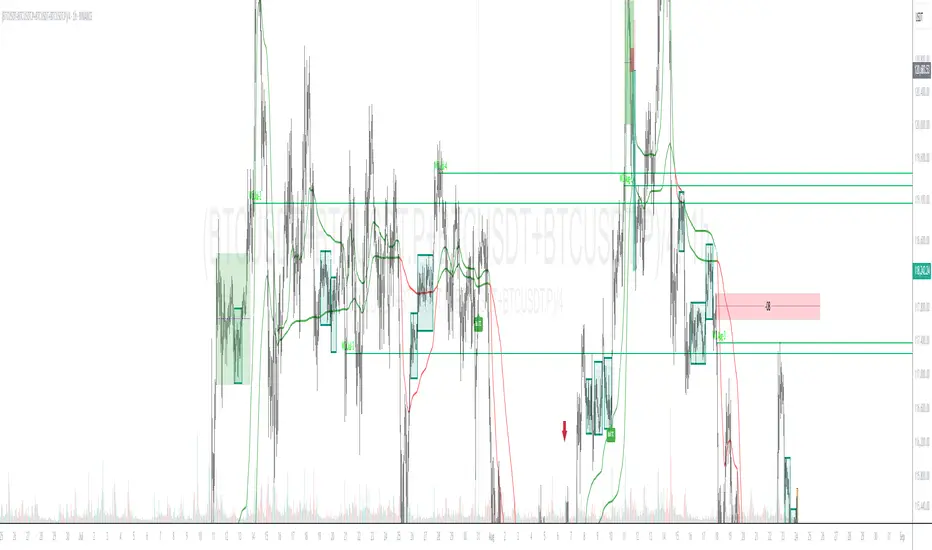
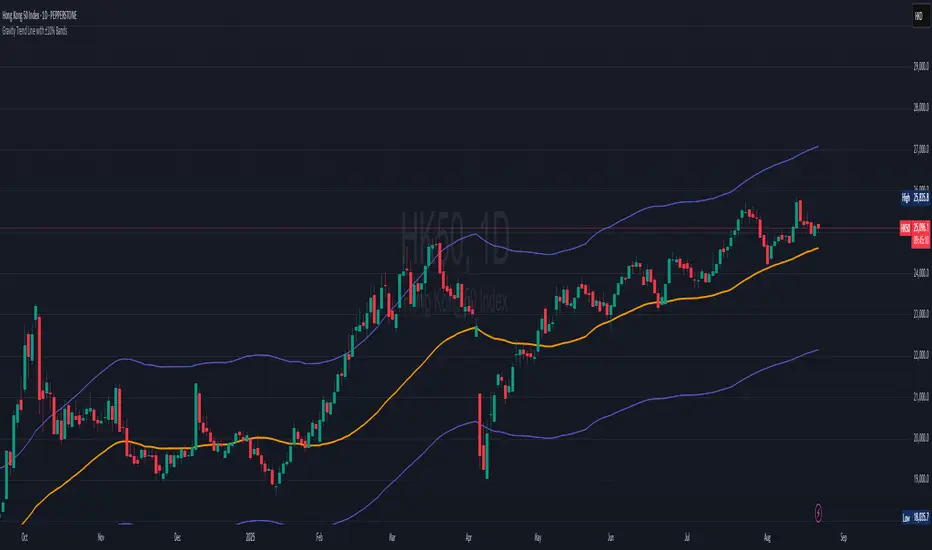
Gravity Trend Line with ±10% Bands_QianYu🌌 Law of Gravity in Stock Trading — by Hu Liyang (胡立阳)—often called the “Godfather of Asian Stock Markets”
✦ Conceptual Origin
The “Law of Gravity” was developed by Mr. Hu Liyang, drawing an analogy between the gravitational pull in physics and the relationship between stock prices and moving averages. It is a medium-term mean reversion theory that helps traders identify rebound opportunities when prices deviate too far from their trend lines.
📈 Indicator Summary: Gravity Trend Line with ±10% Bands
🔧 How It's Calculated:
Gravity Trend Line = Average of SMA(30) and SMA(70)
Represents the fair value zone or center of gravity for price over a medium-term period.
Upper Band = Gravity Line + 10%
Lower Band = Gravity Line - 10%
A shaded zone shows the space between the upper and lower bands — your "gravity channel."
🧭How to Use It for Swing Trading (1H and 4H Charts)
1. Trend Bias Filter
If price is consistently above the Gravity Line, the trend bias is bullish.
If price is below the Gravity Line, the bias is bearish.
Use this to align your trades with the prevailing direction on 4H (macro view) and fine-tune entries on 1H.
2.Trade Entry Zones
Long Setup (buy):
Look for price near or just below the lower band (oversold zone).
Combine with bullish candles or reversal indicators (e.g., MACD bullish crossover, RSI < 30 turning up).
Confirmation: price reclaims the lower band or moves toward gravity line.
Short Setup (sell):
Look for price near or just above the upper band (overbought zone).
Combine with bearish confirmation (e.g., MACD bearish crossover, RSI > 70 turning down).
Confirmation: price starts rejecting from upper band toward gravity line.
3. Take Profit / Exit Zones
Partial TP: At the Gravity Line (mean reversion level).
Final TP: At opposite band (if price has strong momentum).
Alternatively, exit on crossback below gravity line after a long, or above it after a short.
4. Avoiding Traps
Avoid entering trades in the middle of the band (around the Gravity Line) unless there's strong breakout confirmation.
Use 4H for trend context, and 1H for entry precision.
Avoid trading against the broader gravity slope:
If gravity line is clearly sloping up, favor longs.
If sloping down, favor shorts.
📘 Example Strategy Workflow:
Timeframe:
Use 4H for directional bias
Use 1H for entries and exits
Example Long Setup (1H Chart):
Price dips below lower band while 4H trend is up.
Bullish candle forms or RSI/MACD confirms momentum shift.
Entry: price closes back above the lower band.
TP1: near gravity line.
TP2: near upper band.
Or, exit when gain hits +8% to +15%, depending on risk appetite.
📌 Final Notes:
This is a mean-reversion + trend confirmation tool — best used with additional confluence (candlestick patterns, volume, divergence).
It works well in ranging to gently trending markets — not ideal for sharp breakouts unless combined with breakout filters.
This indicator is for educational and reference purposes only.
It is not intended to be a recommendation or signal to buy or sell any security.
Use at your own discretion. Always perform your own due diligence before trading.
Malama's Quantum Swing Modulator# Multi-Indicator Swing Analysis with Probability Scoring
## What Makes This Script Original
This script combines pivot point detection with a **weighted scoring system** that dynamically adjusts indicator weights based on market regime (trending vs. ranging). Unlike standard multi-indicator approaches that use fixed weightings, this implementation uses ADX to detect market conditions and automatically rebalances the influence of RSI, MFI, and price deviation components accordingly.
## Core Methodology
**Dynamic Weight Allocation System:**
- **Trending Markets (ADX > 25):** Prioritizes momentum (50% weight) with reduced oscillator influence (20% each for RSI/MFI)
- **Ranging Markets (ADX < 25):** Emphasizes mean reversion signals (40% each for RSI/MFI) with no momentum bias
- **Price Wave Component:** Uses EMA deviation normalized by ATR to measure distance from central tendency
**Pivot-Based Level Analysis:**
- Detects swing highs/lows using configurable left/right lookback periods
- Maintains the most recent pivot levels as key reference points
- Calculates proximity scores based on current price distance from these levels
**Volume Confirmation Logic:**
- Defines "volume entanglement" when current volume exceeds SMA by user-defined factor
- Integrates volume confirmation into confidence scoring rather than signal generation
## Technical Implementation Details
**Scoring Algorithm:**
The script calculates separate bullish and bearish "superposition" scores using:
```
Bullish Score = (RSI_bull × weight) + (MFI_bull × weight) + (price_wave × weight × position_filter) + (momentum × weight)
```
Where:
- RSI_bull = 100 - RSI (inverted for oversold bias)
- MFI_bull = 100 - MFI (inverted for oversold bias)
- Position_filter = Only applies when price is below EMA for bullish signals
- Momentum component = Only active in trending markets
**Confidence Calculation:**
Base confidence starts at 25% and increases based on:
- Market regime alignment (trending/ranging appropriate conditions)
- Volume confirmation presence
- Oscillator extreme readings (RSI < 30 or > 70 in ranging markets)
- Price position relative to wave function (EMA)
**Probability Output:**
Final probability = (Base Score × 0.6) + (Proximity Score × 0.4)
This balances indicator confluence with proximity to identified levels.
## Key Differentiators
**vs. Standard Multi-Indicator Scripts:** Uses regime-based dynamic weighting instead of fixed combinations
**vs. Simple Pivot Indicators:** Adds quantified probability and confidence scoring to pivot levels
**vs. Basic Oscillator Combinations:** Incorporates market structure analysis through ADX regime detection
## Visual Components
**Wave Function Display:** EMA with ATR-based uncertainty bands for trend context
**Pivot Markers:** Clear visualization of detected swing highs and lows
**Analysis Table:** Real-time probability, confidence, and action recommendations for current pivot levels
## Practical Application
The dynamic weighting system helps avoid common pitfalls of multi-indicator analysis:
- Reduces oscillator noise during strong trends by emphasizing momentum
- Increases mean reversion sensitivity during sideways markets
- Provides quantified probability rather than subjective signal interpretation
## Important Limitations
- Requires sufficient historical data for pivot detection and volume calculations
- Probability scores are based on current market regime and may change as conditions evolve
- The scoring system is designed for confluence analysis, not standalone trading decisions
- Past probability accuracy does not guarantee future performance
## Technical Requirements
- Works on all timeframes but requires adequate lookback history
- Volume data required for entanglement calculations
- Best suited for liquid instruments where volume patterns are meaningful
This approach provides a systematic framework for evaluating swing trading opportunities while acknowledging the probabilistic nature of technical analysis.

Price Acceleration Matrix [QuantAlgo]🟢 Overview
The Price Acceleration Matrix indicator is an advanced momentum analysis tool that measures the rate of change in price velocity across multiple timeframes simultaneously. It transforms raw price data into velocity measurements for each timeframe, then calculates the acceleration of these velocities to identify when momentum is building or deteriorating. By analyzing acceleration alignment across all three timeframes, the system can distinguish between strong directional moves (all timeframes accelerating in the same direction) and weak, choppy movements (mixed acceleration signals). This multi-timeframe acceleration matrix provides traders with early warning signals for momentum shifts, trend continuation and reversal opportunities across different timeframes and asset classes.
🟢 How It Works
The indicator employs a three-stage calculation process that transforms price data into actionable acceleration signals. First, it calculates velocity (rate of price change) for each of the three user-defined timeframes by measuring the percentage change in price over the specified lookback periods. These velocity calculations are normalized by their respective timeframe lengths to ensure fair comparison across different periods.
In the second stage, the system calculates acceleration by measuring the change in velocity from one bar to the next for each timeframe, effectively capturing the second derivative of price movement. This acceleration data reveals whether momentum is building (positive acceleration) or deteriorating (negative acceleration) at each timeframe level.
The final stage creates the acceleration matrix score by evaluating alignment across all three timeframes. When all timeframes show positive acceleration, the system averages them for maximum bullish signal strength. When all show negative acceleration, it averages them for maximum bearish signal strength. However, when acceleration signals are mixed across timeframes, the system applies a penalty by dividing the average by two, indicating consolidation or conflicting momentum forces. The resulting signal is then smoothed using an Exponential Moving Average and scaled to the -3 to +3 range using a user-defined threshold parameter.
🟢 How to Use
1. Signal Interpretation and Momentum Analysis
Positive Territory (Above Zero): Indicates accelerating upward momentum with bullish bias and favorable conditions for long positions
Negative Territory (Below Zero): Signals accelerating downward momentum with bearish bias and favorable conditions for short positions
Extreme Levels (±2 to ±3): Represent maximum acceleration alignment across all timeframes, indicating high-probability momentum continuation
Moderate Levels (±1 to ±2): Suggest building momentum with good timeframe alignment but less conviction than extreme readings
Near Zero (-0.5 to +0.5): Indicates mixed signals, consolidation, or momentum exhaustion requiring caution
2. Overbought/Oversold Zone Analysis
Above +2 (Overbought Zone): Markets showing extreme bullish acceleration may be due for profit-taking or short-term pullbacks
Below -2 (Oversold Zone): Markets showing extreme bearish acceleration may present reversal opportunities or bounce potential
Zone Exits: When acceleration retreats from extreme zones, it often signals momentum exhaustion and potential trend changes
🟢 Pro Tips for Trading
→ Early Momentum Detection: Watch for acceleration crossing above zero after periods of negative readings, as this often precedes major price movements by several bars, providing early entry opportunities before traditional indicators signal.
→ Momentum Exhaustion Signals: Exit or take profits when acceleration reaches extreme levels (±2.5 or higher) and begins to decline, even if price continues in the same direction, as momentum deterioration typically precedes price reversals.
→ Acceleration Divergence Strategy: Look for divergences between price highs/lows and acceleration peaks/troughs, as these often signal weakening momentum and potential reversal opportunities before they become apparent on price charts.
→ Threshold Optimization: Adjust the acceleration threshold based on asset volatility - higher thresholds (0.7-1.0) for volatile assets to reduce false signals, lower thresholds (0.3-0.5) for stable assets to maintain sensitivity.
→ Alert-Based Trading: Utilize the built-in alert system for bullish/bearish reversals (±2 level crosses) and trend changes (zero line crosses) to capture momentum shifts without constant chart monitoring, especially effective for swing trading approaches.
→ Risk Management Integration: Reduce position sizes when acceleration readings are weak (below ±1.0) and increase allocation when strong acceleration alignment occurs (above ±2.0), as signal strength correlates directly with probability of successful trades.

Anchored VWAP by Fin VirajSimple Anchored VWAP with Directional Colors
📊 Overview
A clean and efficient Anchored VWAP (Volume Weighted Average Price) indicator with dynamic directional coloring. This indicator provides traders with a reliable reference point for price action analysis based on volume-weighted calculations from specific anchor points.
✨ Key Features
🎯 Multiple Anchor Types
Session: Anchors to daily trading session start
Day: Resets at the beginning of each trading day
Week: Weekly anchor points for swing trading
Month: Monthly anchors for longer-term analysis
Manual Date: Set custom anchor date for specific events
🌈 Directional Color System
🟢 Green: Price above VWAP with upward momentum
🔴 Red: Price below VWAP with downward momentum
🔵 Blue: Neutral/transitional conditions
📏 Standard Deviation Bands
Customizable multipliers (default: 1.0 and 2.0)
Toggle on/off as needed
Support and resistance levels based on statistical deviation
Filled area between bands for better visualization
🔧 Settings & Customization
Input Parameters
Anchor Type: Choose from 5 different anchor methods
Manual Anchor Date: Set specific date for manual anchoring
Reset Anchor Point: Manual reset button
Show Standard Deviation Bands: Toggle bands visibility
Band Multipliers: Adjust band distance (1σ and 2σ)
VWAP Line Width: Customize line thickness (1-4)
Color Customization
Bullish Color: Customize uptrend color
Bearish Color: Customize downtrend color
Neutral Color: Customize neutral state color
Band Color: Customize standard deviation bands color
📈 How to Use
For Day Trading
Set anchor type to "Session" or "Day"
Use VWAP as dynamic support/resistance
Green color = bullish bias, Red color = bearish bias
For Swing Trading
Set anchor type to "Week" or "Month"
Longer-term VWAP acts as major S/R level
Standard deviation bands show potential reversal zones
For Event-Based Analysis
Set anchor type to "Manual Date"
Choose significant event date (earnings, news, etc.)
Analyze price behavior relative to that anchor point
🎨 Visual Interpretation
VWAP Line Colors
Bright Green: Strong bullish momentum (price above rising VWAP)
Bright Red: Strong bearish momentum (price below falling VWAP)
Blue: Neutral conditions or transitional phase
Standard Deviation Bands
Upper Bands: Potential resistance levels
Lower Bands: Potential support levels
Band Touches: Often indicate reversal or continuation points
💡 Trading Applications
Support & Resistance
VWAP acts as dynamic support in uptrends
VWAP acts as dynamic resistance in downtrends
Standard deviation bands provide additional S/R levels
Trend Analysis
Price consistently above VWAP = bullish trend
Price consistently below VWAP = bearish trend
Color changes help identify trend shifts
Entry & Exit Points
Use VWAP reclaims for potential long entries
Use VWAP breaks for potential short entries
Standard deviation bands for profit-taking levels
⚙️ Technical Details
Pine Script Version: v6
Overlay: Yes (plots on price chart)
Calculation: Volume-weighted average price from anchor point
Standard Deviation: Statistical measure of price dispersion
Performance: Optimized for real-time calculation
🔄 Anchor Reset Logic
The indicator automatically resets based on selected anchor type:
Session/Day: Resets at market open
Week: Resets at week start
Month: Resets at month start
Manual: Resets from chosen date
Manual Reset: Override button for immediate reset
📋 Best Practices
Choose appropriate timeframe for your anchor type
Combine with volume analysis for better confirmation
Use multiple timeframes for comprehensive analysis
Consider market context when interpreting signals
Test on demo before live trading
⚠️ Disclaimer
This indicator is for educational and informational purposes only. Always conduct your own analysis and risk management before making trading decisions.

Historical & Periodic Key LevelsHistorical & Periodic Key Levels
This indicator automatically plots historical key levels (ATH/ATL) and periodic closing levels (Daily, Weekly, Monthly, Yearly). It highlights major price zones frequently used in technical and institutional trading.
Key Features:
Dynamic ATH/ATL: tracks all-time high/low with date annotation.
Periodic Closes: previous D/W/M/Y closes with directional coloring.
Adaptive Colors: green/red based on bullish or bearish close.
Full Customization: toggle visibility, colors, line width, text alignment, and label text.
Smart Label Management: prevents overlap by cycling through label styles automatically.
Usage:
Identify strong support/resistance levels.
Monitor key closing prices across multiple timeframes.
Enhance swing trading and long-term analysis with institutional reference levels.
Inputs:
Levels Visibility: show/hide ATH, ATL, and periodic closes.
ATH/ATL Style Settings: line colors, label prefix, width, and text alignment.
Periodic Levels Style: label text (D/W/M/Y), line width, alignment, and bullish/bearish colors.
Notes:
Levels adjust automatically to the active chart timeframe.
Lower timeframe levels are hidden when redundant (e.g., daily close on daily chart).

Scalper SMA-RSI-MACD – Entry/Exit Signals v2Scalper SMA–RSI–MACD Strategy (Intraday) – Indicator Version
This is an intraday scalping and short-term trading tool designed for manual trading. It provides entry and exit signals based on a combination of trend, momentum, and volatility-based risk management.
Core Components
Trend Filter (Optional)
Uses an EMA (default 200) and an SMA ribbon (5/8/13) to identify the primary trend direction.
Only allows long trades in uptrend and short trades in downtrend (can be turned off for more signals).
Entry Conditions
RSI Pullback: Detects oversold (for long) or overbought (for short) conditions based on a short RSI (default length = 4).
MACD Momentum Turn: Detects bullish or bearish MACD crossovers or momentum shifts.
Both conditions must occur within a specified lookback period (default = last 3 bars).
Stop Loss (SL) Placement
SL is placed at a fixed multiple of the ATR (Average True Range) from the entry price (default = 1.5 × ATR).
Adjusting the multiplier changes how far the SL is placed.
Take Profit (TP) Levels
Two targets: TP1 and TP2, each based on R-multiples of the SL distance.
Default: TP1 = 1 × risk (1:1 R/R), TP2 = 2 × risk (1:2 R/R).
Exit Modes (Selectable)
TP1 or SL
TP2 or SL
Opposite signal (exit when the opposite entry condition appears)
Session Filter (Optional)
Can restrict trading signals to specific market hours (default off for more signals).
Signals and Alerts
Displays LONG and SHORT arrows for entries.
Plots SL and TP levels on the chart.
Marks exits as TP, SL, or opposite signal.
Built-in alertcondition() allows creating TradingView alerts for all entry and exit events.
Typical Usage
Works best on 1-minute to 5-minute charts for scalping; can be adapted to higher timeframes for swing trading.
Ideal for manual execution — the trader sees the signal, checks market conditions, and decides whether to enter.
Can be tuned for more or fewer signals by adjusting RSI thresholds, MACD lookback, and trend filter settings.

Pajinko DivergencePJK DIVERGENCE is a custom indicator designed to detect market divergence with high precision by combining multiple key market metrics.
It analyzes the relationship between Price Action and key momentum/trend indicators such as RSI, MACD, ADX, and Volume to highlight potential reversal or trend continuation opportunities.
This multi-layer approach allows traders to:
Spot bullish divergence (when price makes lower lows but momentum makes higher lows).
Spot bearish divergence (when price makes higher highs but momentum makes lower highs).
Filter out weak signals by confirming with trend strength (ADX) and volume activity.
How It Works
The script continuously compares price swings with momentum oscillators to identify divergence.
Bullish signals appear when momentum shows strength despite falling prices.
Bearish signals appear when momentum weakens despite rising prices.
ADX is used to confirm trend conditions, and Volume is analyzed to validate market participation.
How to Use
Apply PJK DIVERGENCE to your chart.
Look for bullish or bearish divergence markers and confirm with trend/volume conditions.
Use divergence signals as an early warning for possible trend reversals or as confirmation for existing trade setups.
For best results, combine with the Semi-Auto EA “Cyborg” to manage entries, exits, and risk.
Example Use Cases
Swing Trading: Spot reversal zones before major price movements.
Trend Following: Use divergence to identify potential pullbacks within a trend.
Breakout Trading: Confirm breakout strength by checking for the absence of bearish divergence.

Multi-Timeframe SMA IndicatorOverview
The Multi-Timeframe Simple Moving Average (SMA) Indicator is a technical analysis tool designed for use in TradingView, written in Pine Script (version 6). It calculates and displays SMAs across multiple timeframes on a single chart, enabling traders to analyze price trends from various temporal perspectives simultaneously. This indicator is particularly useful for traders who employ multi-timeframe analysis to confirm trends, identify support and resistance levels, and make informed trading decisions.
Features
Multiple Timeframes: The indicator supports ten customizable timeframes: 1-minute, 2-minute, 3-minute, 5-minute, 15-minute, 30-minute, 1-hour, 4-hour, daily, and weekly. This allows traders to observe price trends across short-term, medium-term, and long-term perspectives.
Configurable SMA Lengths: Users can adjust the periods for three SMAs: 20-period, 50-period, and 200-period. These lengths are commonly used to represent short-term, medium-term, and long-term trends, respectively.
Customizable Colors: Each SMA (20, 50, and 200) can be assigned a unique color (default: blue for SMA 20, red for SMA 50, green for SMA 200) to distinguish them visually across different timeframes.
Overlay on Chart: The indicator is overlaid directly on the price chart, making it easy to compare SMAs with price action without cluttering the workspace.
Flexible Timeframe Selection: Users can modify the timeframes via input settings, allowing adaptability to different trading strategies (e.g., scalping, swing trading, or long-term investing).
Settings
The indicator provides the following configurable inputs:
Timeframe Inputs
1-Minute Timeframe: Default set to '1' (1-minute chart).
2-Minute Timeframe: Default set to '2'.
3-Minute Timeframe: Default set to '3'.
5-Minute Timeframe: Default set to '5'.
15-Minute Timeframe: Default set to '15'.
30-Minute Timeframe: Default set to '30'.
1-Hour Timeframe: Default set to '60'.
4-Hour Timeframe: Default set to '240'.
Daily Timeframe: Default set to 'D'.
Weekly Timeframe: Default set to 'W'.
SMA Length Inputs
SMA Length 20: Default set to 20 periods (short-term trend).
SMA Length 50: Default set to 50 periods (medium-term trend).
SMA Length 200: Default set to 200 periods (long-term trend).
Color Inputs
SMA 20 Color: Default is blue.
SMA 50 Color: Default is red.
SMA 200 Color: Default is green.
Plot Settings
Each SMA is plotted with a linewidth of 1 for most timeframes, except for the weekly timeframe, which uses a linewidth of 2 for better visibility.
Each SMA is labeled with its respective timeframe and period for easy identification in the chart’s legend.
Advantages
Comprehensive Trend Analysis: By displaying SMAs across multiple timeframes, the indicator allows traders to confirm trends across different scales. For example, a bullish signal on a 1-minute chart can be validated by checking alignment with higher timeframes like the 1-hour or daily charts.
Versatility: The indicator is adaptable to various trading styles, including day trading (using shorter timeframes like 1-minute or 5-minute) and swing trading (using 4-hour or daily timeframes).
Customizability: Traders can adjust SMA lengths and timeframes to suit their specific strategies, such as focusing on shorter periods for faster signals or longer periods for more reliable trends.
Visual Clarity: The use of distinct colors and clear labeling helps traders quickly differentiate between SMAs of different periods and timeframes, reducing confusion on complex charts.
Support and Resistance Identification: The 200-period SMA, in particular, often acts as a dynamic support or resistance level, especially on higher timeframes like daily or weekly, aiding in strategic entry and exit points.
Cross-Platform Compatibility: Built in Pine Script v6, the indicator is fully compatible with TradingView’s platform, ensuring seamless integration and performance.
Usage Tips
Trend Confirmation: Use the alignment of SMAs across timeframes to confirm trends. For instance, when the SMA 20 is above the SMA 50, and both are above the SMA 200 on multiple timeframes, it indicates a strong bullish trend.
Crossover Signals: Look for crossovers between the SMA 20 and SMA 50 for potential buy or sell signals. Confirm these with higher timeframe SMAs to filter out false signals.
Multi-Timeframe Strategy: Combine shorter timeframes (e.g., 1-minute, 5-minute) for entry points and longer timeframes (e.g., 4-hour, daily) for trend direction to enhance trade accuracy.
Adjust SMA Lengths: Experiment with different SMA lengths based on the asset’s volatility. For highly volatile assets, shorter SMAs (e.g., 10 or 15) may provide faster signals, while less volatile assets may benefit from longer SMAs.
Limitations
Lagging Indicator: As with all SMAs, this indicator is based on historical data, which may lag behind rapid price movements, potentially delaying signals in fast-moving markets.
Chart Clutter: Plotting SMAs for all ten timeframes can make the chart visually complex. Traders may need to toggle off certain timeframes to focus on relevant ones.
No Signal Generation: The indicator plots SMAs but does not include built-in alerts or signals for crossovers or trend changes, requiring manual interpretation.
Conclusion
The Multi-Timeframe SMA Indicator is a powerful and flexible tool for traders seeking to incorporate multi-timeframe analysis into their strategies. Its ability to display customizable SMAs across various timeframes provides a comprehensive view of market trends, making it suitable for traders of all experience levels. By leveraging its features, traders can enhance their decision-making process, improve trade timing, and better navigate dynamic market conditions.

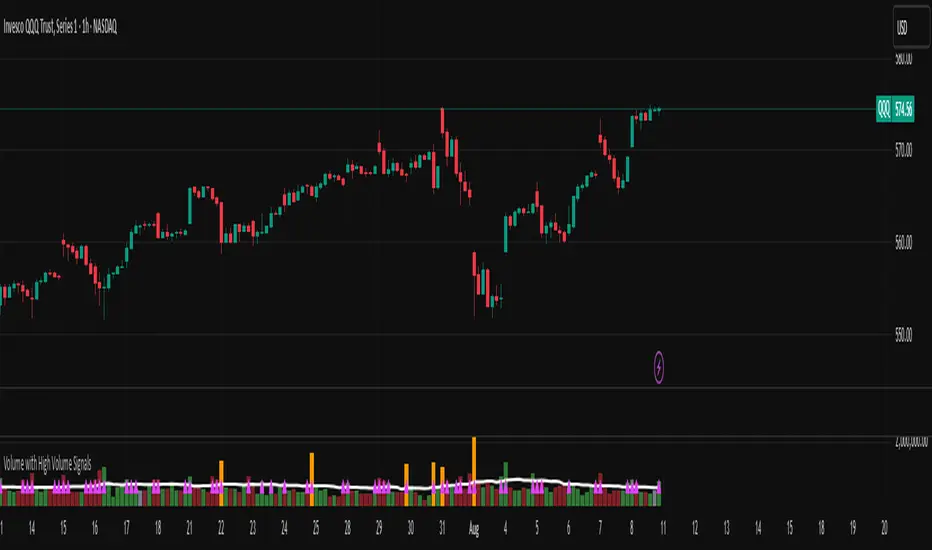
Volume with High Volume SignalsIndicator Description for Promotional Post (in English)
Unlock Market Insights with the "Volume with High Volume Signals" Indicator!
Are you ready to take your trading to the next level? The Volume with High Volume Signals indicator is your ultimate tool for spotting critical market movements driven by volume surges. Designed for traders who want clarity and precision, this Pine Script indicator combines powerful volume analysis with customizable features to help you stay ahead of the game.
Why Choose This Indicator?
Dynamic Volume Visualization: Watch volume bars come to life with customizable coloring. Choose to color bars based on candle direction (green for bullish, red for bearish) or use a neutral gray for a clean look.
High Volume Detection: Instantly spot significant volume spikes with our advanced highlighting feature. When volume exceeds twice the Simple Moving Average (SMA), bars are highlighted in a bold, customizable color (default: yellow) to signal potential breakout or reversal opportunities.
Dual Moving Averages: Track volume trends with both Simple Moving Average (SMA) and Exponential Moving Average (EMA). Fully customizable periods, colors, and line thickness let you tailor the indicator to your trading style.
Visual Alerts for Key Moments: When volume surges above both SMA and EMA, a vibrant fuchsia triangle appears above the bar, giving you an immediate visual cue for high-impact market activity.
User-Friendly Customization: Adjust every aspect of the indicator—toggle SMA/EMA visibility, set periods, choose colors, and fine-tune line thickness to match your preferences.
Perfect For:
Day traders looking for high-volume breakouts.
Swing traders identifying trend reversals.
Any trader who wants to harness volume as a leading indicator.
Why It’s a Must-Have:
Volume is the heartbeat of the market, and this indicator transforms raw data into actionable insights. Whether you're scalping, swing trading, or analyzing long-term trends, the Volume with High Volume Signals indicator empowers you to make informed decisions with confidence.
Get Started Today!
Add the Volume with High Volume Signals indicator to your TradingView arsenal and start decoding market moves like a pro. Don’t miss out on the edge that top traders rely on—grab this indicator now and elevate your trading strategy!
IU Indicators DashboardDESCRIPTION
The IU Indicators Dashboard is a comprehensive multi-stock monitoring tool that provides real-time technical analysis for up to 10 different stocks simultaneously. This powerful indicator creates a customizable table overlay that displays the trend status of multiple technical indicators across your selected stocks, giving you an instant overview of market conditions without switching between charts.
Perfect for portfolio monitoring, sector analysis, and quick market screening, this dashboard consolidates critical technical data into one easy-to-read interface with color-coded trend signals.
USER INPUTS
Stock Selection (10 Configurable Stocks):
- Stock 1-10: Customize any symbols (Default: NSE:CDSL, NSE:RELIANCE, NSE:VEDL, NSE:TCS, NSE:BEL, NSE:BHEL, NSE:TATAPOWER, NSE:TATASTEEL, NSE:ITC, NSE:LT)
Technical Indicator Parameters:
- EMA 1 Length: First Exponential Moving Average period (Default: 20)
- EMA 2 Length: Second Exponential Moving Average period (Default: 50)
- EMA 3 Length: Third Exponential Moving Average period (Default: 200)
- RSI Length: Relative Strength Index calculation period (Default: 14)
- SuperTrend Length: SuperTrend indicator period (Default: 10)
- SuperTrend Factor: SuperTrend multiplier factor (Default: 3.0)
Visual Customization:
- Table Size: Choose from Normal, Tiny, Small, or Large
- Table Background Color: Customize dashboard background
- Table Frame Color: Set frame border color
- Table Border Color: Configure border styling
- Text Color: Set text display color
- Bullish Color: Color for positive/bullish signals (Default: Green)
- Bearish Color: Color for negative/bearish signals (Default: Red)
LOGIC OF THE INDICATOR
The dashboard employs a multi-timeframe analysis approach using five key technical indicators:
1. Triple EMA Analysis
- Compares current price against three different EMA periods (20, 50, 200)
- Bullish Signal: Price above EMA level
- Bearish Signal: Price below EMA level
- Provides short-term, medium-term, and long-term trend perspective
2. RSI Momentum Analysis
- Uses 14-period RSI with 50-level threshold
- Bullish Signal: RSI > 50 (upward momentum)
- Bearish Signal: RSI < 50 (downward momentum)
- Identifies momentum strength and potential reversals
3. SuperTrend Direction
- Utilizes SuperTrend with configurable length and factor
- Bullish Signal: SuperTrend direction = -1 (uptrend)
- Bearish Signal: SuperTrend direction = 1 (downtrend)
- Provides clear trend direction with volatility-adjusted signals
4. MACD Histogram Analysis
- Uses standard MACD (12, 26, 9) histogram values
- Bullish Signal: Histogram > 0 (bullish momentum)
- Bearish Signal: Histogram < 0 (bearish momentum)
- Identifies momentum shifts and trend confirmations
5. Real-time Data Processing
- Implements request.security() for multi-symbol data retrieval
- Uses barstate.isrealtime logic for accurate live data
- Processes data only on the last bar for optimal performance
WHY IT IS UNIQUE
Multi-Stock Monitoring
- Monitor up to 10 different stocks simultaneously on a single chart
- No need to switch between multiple charts or timeframes
Highly Customizable Interface
- Full color customization for personalized visual experience
- Adjustable table size and positioning
- Clean, professional dashboard design
Real-time Analysis
- Live data processing with proper real-time handling
- Instant visual feedback through color-coded signals
- Optimized performance with smart data retrieval
Comprehensive Technical Coverage
- Combines trend-following, momentum, and volatility indicators
- Multiple timeframe perspective through different EMA periods
- Balanced approach using both lagging and leading indicators
Flexible Configuration
- Easy symbol switching for different markets (NSE, BSE, NYSE, NASDAQ)
- Adjustable indicator parameters for different trading styles
- Suitable for both swing trading and position trading
HOW USERS CAN BENEFIT FROM IT
Portfolio Management
- Quick Portfolio Health Check: Instantly assess the technical status of your entire stock portfolio
- Diversification Analysis: Monitor stocks across different sectors to ensure balanced exposure
- Risk Management: Identify which positions are showing bearish signals for potential exit strategies
- Rebalancing Decisions: Spot strongest performers for potential position increases
Market Screening and Analysis
- Sector Rotation: Compare different sector stocks to identify rotation opportunities
- Relative Strength Analysis: Quickly identify which stocks are outperforming or underperforming
- Market Breadth Assessment: Gauge overall market sentiment by monitoring diverse stock selections
- Trend Confirmation: Validate market trends by observing multiple stock behaviors
Time-Efficient Trading
- Single-Glance Analysis: Get complete technical overview without chart-hopping
- Pre-Market Preparation: Quickly assess overnight changes across multiple positions
- Intraday Monitoring: Track multiple opportunities simultaneously during trading hours
- End-of-Day Review: Efficiently review all watched stocks for next-day planning
Strategic Decision Making
- Entry Point Identification: Spot stocks showing bullish alignment across multiple indicators
- Exit Signal Recognition: Identify positions showing deteriorating technical conditions
- Swing Trading Opportunities: Find stocks with favorable technical setups for swing trades
- Long-term Investment Guidance: Use 200 EMA signals for long-term position decisions
Educational Benefits
- Pattern Recognition: Learn how different indicators behave across various market conditions
- Correlation Analysis: Understand how stocks move relative to each other
- Technical Analysis Learning: Observe multiple indicator interactions in real-time
- Market Sentiment Understanding: Develop better market timing skills through multi-stock observation
Workflow Optimization
- Reduced Chart Clutter: Keep your main chart clean while monitoring multiple stocks
- Faster Analysis: Complete technical analysis of 10 stocks in seconds instead of minutes
- Consistent Methodology: Apply the same technical criteria across all monitored stocks
- Alert Integration: Easy visual identification of stocks requiring immediate attention
This indicator is designed for traders and investors who want to maximize their market awareness while minimizing analysis time. Whether you're managing a portfolio, screening for opportunities, or learning technical analysis, the IU Indicators Dashboard provides the comprehensive overview you need for better trading decisions.
DISCLAIMER :
This indicator is not financial advice, it's for educational purposes only highlighting the power of coding( pine script) in TradingView, I am not a SEBI-registered advisor. Trading and investing involve risk, and you should consult with a qualified financial advisor before making any trading decisions. I do not guarantee profits or take responsibility for any losses you may incur.

Up On Volume Screener [LevelUp]The Up On Volume Screener is a powerful scanner designed to identify stocks exhibiting strong bullish momentum, characterized by a higher close on the day or week accompanied by a significant spike in trading volume compared to the average. This screener allows traders to customize parameters such as moving average lengths, closing range requirements, and proximity to 52-week highs using multiples of the ATR (average true range).
By pinpointing stocks with robust buying pressure and high volume, the Up On Volume screener helps traders uncover potential breakout opportunities, early trend leaders, and stocks demonstrating relative strength, making it an essential tool for momentum, swing, and growth trading strategies.
🔹 Why Search For Up On Volume?
▪ Confirmation of Bullish Momentum: Stocks that close higher on the day/week signal buying pressure and bullish sentiment throughout the session. This helps traders and investors identify names that are attracting demand, possibly due to news, earnings, or sector strength.
▪ Volume Adds Conviction: When a stock closes up with increased volume, it suggests strong participation behind the move — not just a “head fake” or a thinly traded rally. High volume confirms that institutional players or multiple market participants are involved, which often leads to more reliable price trends.
▪ Early Stage Moves: Daily breakouts can often mark the beginning of a larger trend. Catching stocks on days they close up helps pinpoint emerging leaders and stocks transitioning from accumulation to bullish phases.
▪ Technical Strength: A bullish close (especially in the top half of the day’s price range) is a technical sign of demand. This is a favored criterion in many technical analysis strategies for swing trading, momentum trading, and even fundamental breakouts.
🔹 When Is Up On Volume Screen Most Helpful?
▪ After Market Close: Stocks that show strength and close up on high volume often show continued follow-through in the coming days/weeks.
▪ After Major News/Events: When stocks respond positively to news releases, earnings, or sector movements, searching for those that close up can help you catch momentum before it’s widely recognized.
▪ Trend Days: On days when the market is trending (not sideways or choppy), screening for stocks closing up helps you align with the strongest moves and avoid false signals.
▪ Early in Bullish Cycles: Searching for stocks closing up during the early stage of a market rally or sector rotation can help growth traders get in ahead of sustained upward moves.a
▪ Relative Strength Signals True Leadership: When most stocks decline in a weak market, those that hold firm or rise are showing clear relative strength. This means buyers are stepping in even when the broader mood is negative, often signaling institutional accumulation — these are the names likely to become tomorrow’s winners.
▪ Early Clues to New Cycles: Throughout history, the biggest winners in bull markets often began their runs during corrections and bear phases, not after the headlines turn positive. By focusing on stocks that close green on red days, you’re hunting for companies quietly building buying pressure, poised to break out when the tide turns.
▪ Faster Recoveries and Outperformance: Stocks that resist declines tend to rebound earlier and outpace the broader market once conditions improve. These resilient names frequently end up delivering outsized returns, often leading sector rallies or driving new market themes.
🔹 Screening Features - Setting Your Search Criteria
There are various search options that can be customized.
✓ Volume Gap Up %: Minimum volume percent change over the average volume.
✓ Moving Average: Set length for average volume calculations on daily and weekly timeframes.
✓ Closing Range %: Specify the preferred closing range on the day or week.
✓ Price With X ATR of 52-Week High: Filter for stocks within X ATRs of their 52-week highs.
🔹 Installation And Usage
▪ Mark this indicator as a Favorite.
▪ Use the Pine Screener to search for stocks.
▪ Save the search results to a watchlist.
▪ View the watchlist in TradingView.
🔹 Note
Some high-volume breakout scans rely on proprietary formulas. With this screener, every filter can be researched and verified - no black box! The only variables are price, volume % change, closing range and price within a specified ATR of the 52-week high.

ML Compressor Enhanced Trading Indicator# 🤖 ML Enhanced Trading Indicator - Advanced Market Analysis
## 📊 Overview
This is a comprehensive Machine Learning Enhanced Trading Indicator that combines multiple advanced analytical techniques to provide high-probability trading signals. The indicator uses artificial intelligence, pattern recognition, anomaly detection, and traditional technical analysis to identify optimal entry and exit points in the market.
## 🚀 Key Features
### 🧠 **Machine Learning Core**
- **Advanced Pattern Recognition**: Uses cosine similarity, Pearson correlation, and Spearman rank correlation to identify historical patterns
- **AI-Powered Predictions**: Implements multiple correlation methods to forecast price movements
- **Anomaly Detection**: Z-score based detection system for unusual market activities
- **Signal Confidence Scoring**: Reliability assessment for each trading signal
### 📈 **Technical Analysis Integration**
- **Multi-Timeframe RSI Analysis**: 14 and 21-period RSI with oversold/overbought detection
- **MACD Momentum**: Enhanced MACD histogram analysis for trend confirmation
- **Bollinger Bands Position**: Dynamic position tracking within BB channels
- **Volume Analysis**: Spike and dry volume detection with ratio calculations
- **Trend Strength Measurement**: EMA-based trend power analysis
### 🎯 **Perfect Zone Detection**
- **Ideal Buy Zone**: Identifies perfect buying opportunities when 7 conditions align:
- ML Score ≥ 0.60
- Bottom proximity detection
- RSI in 20-35 range
- Volume spike confirmation
- Positive price anomaly
- Bullish pattern match
- Positive MACD momentum
### 📊 **Comprehensive Display Table**
- **Real-time ML Analysis**: Complete breakdown of all indicators
- **Perfect Buy Conditions Tracker**: Visual checklist with completion percentage
- **Performance Metrics**: Win rate tracking and P&L analysis
- **Signal Strength Indicators**: Confidence levels for each signal
## 🔧 **Customizable Parameters**
### **ML Settings**
- **ML Lookback Period**: 20-500 bars (default: 100)
- **Anomaly Threshold**: 1.0-5.0 sensitivity (default: 2.0)
- **Pattern Similarity**: 0.5-0.99 matching threshold (default: 0.80)
- **AI Lookback Period**: 20-200 bars (default: 50)
### **AI Prediction Models**
- **Correlation Methods**: Spearman, Pearson, Cosine Similarity
- **Forecast Length**: 15-250 bars (default: 50)
- **Similarity Type**: Price or %Change analysis
### **Visual Options**
- **Table Position**: Top/Bottom Left/Right positioning
- **Table Size**: Small, Normal, Large options
- **Signal Display**: Toggle buy/sell signals on/off
- **AI Visualization**: Optional prediction paths and ZigZag
## 📋 **How to Use**
### **For Beginners**
1. Add the indicator to your chart
2. Look for "PERFECT BUY" signals in the table
3. Wait for completion percentage ≥ 85% for highest probability trades
4. Use the background color changes as visual confirmation
### **For Advanced Traders**
1. Analyze individual ML components in the detailed table
2. Monitor anomaly detection for unusual market conditions
3. Use pattern confidence levels for trade timing
4. Combine with your existing strategy for confirmation
### **Signal Interpretation**
- **🟢 PERFECT BUY**: All 7 conditions met - highest probability reversal
- **🟡 NEAR BOTTOM**: Close to ideal conditions - monitor closely
- **🔴 NOT READY**: Wait for better setup
- **Strong Buy/Sell Signals**: ML score-based entries with high confidence
## ⚠️ **Important Notes**
### **Risk Management**
- This indicator provides analysis and signals, not guaranteed outcomes
- Always use proper risk management and position sizing
- Consider market conditions and fundamental factors
- Backtest the strategy on your preferred timeframes and assets
### **Best Practices**
- Use multiple timeframe analysis for confirmation
- Combine with support/resistance levels
- Monitor volume confirmation for all signals
- Set appropriate stop-losses and profit targets
### **Performance Tracking**
- The indicator tracks its own performance with win rate calculations
- Monitor the "AI Prediction" accuracy percentage
- Use the P&L tracking to assess signal quality over time
## 🔄 **Updates and Improvements**
This indicator is continuously evolving with:
- Enhanced machine learning algorithms
- Improved pattern recognition capabilities
- Additional correlation methods for better accuracy
- Performance optimization for faster calculations
- New visualization features based on user feedback
## 📚 **Technical Details**
### **Machine Learning Implementation**
- **Pattern Matching**: 20-bar normalized price patterns with historical comparison
- **Correlation Analysis**: Mathematical similarity scoring between current and historical patterns
- **Anomaly Detection**: Statistical Z-score analysis across price, volume, and RSI
- **Signal Weighting**: Multi-factor scoring system with optimized weights
### **Algorithm Components**
1. **Feature Extraction**: Price, volume, momentum, volatility, and trend features
2. **Pattern Recognition**: Historical pattern database with similarity matching
3. **Anomaly Detection**: Multi-dimensional Z-score threshold analysis
4. **Signal Generation**: Weighted scoring system with confidence intervals
5. **Performance Tracking**: Real-time win rate and accuracy monitoring
### **Calculation Methods**
- **Trend Strength**: (EMA8 - EMA21) / EMA21 * 100
- **Volume Ratio**: Current Volume / 20-period SMA Volume
- **BB Position**: (Close - BB_Lower) / (BB_Upper - BB_Lower)
- **Anomaly Score**: Average of normalized Z-scores for price, volume, and RSI
## 🎨 **Visual Elements**
### **Background Colors**
- **Light Green**: Perfect buy zone detected
- **Light Red**: Perfect sell zone detected
- **Light Blue**: Near bottom proximity
- **Green/Red Transparency**: Price anomaly detection
### **Signal Shapes**
- **Green Triangle Up**: Strong buy signal
- **Red Triangle Down**: Strong sell signal
- **Aqua Diamond**: Perfect buy zone entry
- **Purple Diamond**: Perfect sell zone entry
### **Table Information**
- **ML Complete Analysis**: 16 comprehensive metrics
- **Perfect Buy Conditions**: 7-point checklist with status indicators
- **Real-time Values**: Live updating of all calculations
- **Color-coded Status**: Green (good), Yellow (moderate), Red (caution)
## 🔍 **Troubleshooting**
### **Common Issues**
- **Table Not Showing**: Enable "Show ML Table" in settings
- **No Signals Appearing**: Check "Show Buy/Sell Signals" option
- **Performance Issues**: Reduce ML Lookback Period for faster calculation
- **Too Many/Few Signals**: Adjust Anomaly Threshold sensitivity
### **Optimization Tips**
- **For Day Trading**: Use lower timeframes (1m, 5m, 15m) with reduced lookback periods
- **For Swing Trading**: Use higher timeframes (1h, 4h, 1D) with standard settings
- **For Scalping**: Enable only strong signals and reduce pattern similarity threshold
- **For Long-term**: Increase all lookback periods and use daily/weekly timeframes
## 📖 **Disclaimer**
This indicator is for educational and informational purposes only. It should not be considered as financial advice. Trading involves substantial risk of loss and is not suitable for all investors. Past performance does not guarantee future results.
### **Risk Warning**
- All trading involves risk of substantial losses
- Never risk more than you can afford to lose
- This indicator does not guarantee profitable trades
- Always use proper risk management techniques
- Consider consulting with a financial advisor
### **Liability**
The creator of this indicator is not responsible for any losses incurred from its use. Users should thoroughly test and understand the indicator before using it with real money.
### **Feature Requests**
- Suggest improvements through TradingView comments
- Report bugs with detailed descriptions
- Share successful strategies using the indicator
- Contribute to community discussions
## 🏆 **Credits and Acknowledgments**
This indicator builds upon various open-source libraries and mathematical concepts:
- TradingView ZigZag library for visualization
- Statistical correlation methods from academic research
- Machine learning concepts adapted for financial markets
- Community feedback and testing contributions
## 📈 **Performance Metrics**
The indicator includes built-in performance tracking:
- **Win Rate Calculation**: Percentage of profitable signals
- **Signal Accuracy**: ML prediction vs actual price movement
- **Drawdown Tracking**: Current unrealized P&L from last signal
- **Completion Percentage**: How many perfect conditions are met
## 🔬 **Mathematical Foundation**
### **Correlation Calculations**
- **Pearson**: Measures linear correlation between patterns
- **Spearman**: Rank-based correlation for non-linear relationships
- **Cosine Similarity**: Vector-based similarity for pattern matching
### **Statistical Methods**
- **Z-Score**: (Value - Mean) / Standard Deviation
- **Pattern Normalization**: Price / Price
- **Volatility Percentile**: Historical ranking of current volatility
- **Momentum Calculation**: Price change over multiple periods
## 🎯 **Trading Strategies**
### **Conservative Approach**
- Wait for Perfect Buy Zone (85%+ completion)
- Use higher timeframes for confirmation
- Set stop-loss at recent swing low
- Take profits at resistance levels
### **Aggressive Approach**
- Trade on Strong Buy/Sell signals
- Use lower completion thresholds (70%+)
- Tighter stop-losses with faster exits
- Higher position sizes with confirmed trends
### **Hybrid Strategy**
- Combine with other indicators for confirmation
- Use different settings for different market conditions
- Scale in/out based on signal strength
- Adjust parameters based on market volatility

_mr_beach Sunday Entwicklung Version 1_mr_beach Sunday Development Version 1
Short Description (for TradingView publication):
This indicator combines EMA crossovers, VWAP with standard deviation bands, gap detection, pivot-based support & resistance, and VWAP distance labels in a single overlay. Perfect for discretionary traders aiming to efficiently identify gap fills, trend reversals, and key price levels. All components can be toggled on/off via the settings menu.
Full Indicator Description:
🧠 Purpose of the Indicator:
This all-in-one tool merges several analytical features to visualize trend direction, market structure, key price levels (e.g., gaps, VWAP distance, pivot support), and entry signals at a glance.
🔧 Integrated Features:
EMA20 / EMA50: Trend detection via moving averages. Crossover signals indicate potential entries.
VWAP + Band: Volume-weighted average price with visual deviation bands.
GAP-Up / GAP-Down: Price gaps are highlighted in color (brown/yellow), optionally showing only open ones.
VWAP Distance Label: Displays the current price’s percentage deviation from the VWAP as a chart label.
Buy/Sell Signals: Triggered by EMA20 and EMA50 crossovers.
HH/LL SL-Marker: Identifies local highs/lows using pivots.
Support & Resistance: Automatically calculated pivot zones.
Customizable Visibility: All features can be toggled in the settings menu.
Dummy Plot: plot(na) ensures error-free compilation.
⚙️ Settings Menu Options:
Show VWAP: Displays VWAP and deviation bands.
Show EMA20 / EMA50: Shows the moving averages.
Show Gaps: Enables gap detection.
Show Only Open Gaps: Hides already filled gaps.
Show VWAP Distance: Activates VWAP deviation label.
Support & Resistance: Displays pivot-based zones as support/resistance.
🔔 Alerts:
‘Mads Morningstar Signal’: Buy/Sell alerts based on EMA crossover.
📈 Use Cases:
Trend-following setups using EMA crossover
Gap-fill trading strategies
VWAP reversion trades
SL/TP based on HH/LL or pivot levels
Visual chart preparation for scalping, intraday, or swing trading
🛠 Suggested Extensions:
Gap table showing open levels
Take-Profit/Stop-Loss strategy
Alerts for new gap formation
Strategy tester module with gap-based entries

Mutanabby_AI | Fresh Algo V24Mutanabby_AI | Fresh Algo V24: Advanced Multi-Mode Trading System
Overview
The Mutanabby_AI Fresh Algo V24 represents a sophisticated evolution of multi-component trading systems that adapts to various market conditions through advanced operational configurations and enhanced analytical capabilities. This comprehensive indicator provides traders with multiple signal generation approaches, specialized assistant functions, and dynamic risk management tools designed for professional market analysis across diverse trading environments.
Primary Signal Generation Framework
The Fresh Algo V24 operates through two fundamental signal generation approaches that accommodate different market perspectives and trading philosophies. The Trending Signals Mode serves as the primary trend-following mechanism, combining Wave Trend Oscillator analysis with Supertrend directional signals and Squeeze Momentum breakout detection. This mode incorporates ADX filtering that requires values exceeding 20 to ensure sufficient trend strength exists before signal activation, making it particularly effective during sustained directional market movements where momentum persistence creates profitable trading opportunities.
The Contrarian Signals Mode provides an alternative approach targeting reversal opportunities through extreme market condition identification. This mode activates when the Wave Trend Oscillator reaches critical threshold levels, specifically when readings surpass 65 indicating potential bearish reversal conditions or drop below 35 suggesting bullish reversal opportunities. This methodology proves valuable during overextended market phases where mean reversion becomes statistically probable.
Advanced Filtering Mechanisms
The system incorporates multiple sophisticated filtering mechanisms designed to enhance signal quality and reduce false positive occurrences. The High Volume Filter requires volume expansion confirmation before signal activation, utilizing exponential moving average calculations to ensure institutional participation accompanies price movements. This filter substantially improves signal reliability by eliminating low-conviction breakouts that lack adequate volume support from professional market participants.
The Strong Filter provides additional trend confirmation through 200-period exponential moving average analysis. Long position signals require price action above this benchmark level, while short position signals necessitate price action below it. This ensures strategic alignment with longer-term trend direction and reduces the probability of trading against major market movements that could invalidate shorter-term signals.
Cloud Filter Configuration System
The Fresh Algo V24 offers four distinct cloud filter configurations, each optimized for specific trading timeframes and market approaches. The Smooth Cloud Filter utilizes the mathematical relationship between 150-period and 250-period exponential moving averages, providing stable trend identification suitable for position trading strategies. This configuration generates signals exclusively when price action aligns with cloud direction, creating a more deliberate but highly reliable signal generation process.
The Swing Cloud Filter employs modified Supertrend calculations with parameters specifically optimized for swing trading timeframes. This filter achieves optimal balance between responsiveness and stability, adapting effectively to medium-term price movements while filtering excessive market noise that typically affects shorter-term analytical systems.
For active intraday traders, the Scalping Cloud Filter utilizes accelerated Supertrend calculations designed to capture rapid trend changes effectively. This configuration provides enhanced signal generation frequency suitable for compressed timeframe strategies. The advanced Scalping+ Cloud Filter incorporates Hull Moving Average confirmation, delivering maximum responsiveness for ultra-short-term trading while maintaining signal quality through additional momentum validation processes.
Specialized Assistant Functionality
The system includes two distinct assistant modes that provide supplementary market analysis capabilities. The Trend Assistant Mode activates advanced cloud analysis overlays that display dynamic support and resistance zones calculated through adaptive volatility algorithms. These levels automatically adjust to current market conditions, providing visual guidance for identifying trend continuation patterns and potential reversal areas with mathematical precision.
The Trend Tracker Mode concentrates on long-term trend identification by displaying major exponential moving averages with color-coded fill areas that clarify directional bias. This mode maintains visual simplicity while providing comprehensive trend context evaluation, enabling traders to quickly assess broader market direction and align shorter-term strategies accordingly.
Dynamic Risk Management System
The integrated risk management system automatically adapts across all operational modes, calculating stop loss and take profit targets using Average True Range multiples that adjust to current market volatility. This approach ensures consistent risk parameters regardless of selected operational mode while maintaining relevance to prevailing market conditions.
Stop loss placement occurs at dynamically calculated distances from entry points, while three progressive take profit targets establish at customizable ATR multiples respectively. The system automatically updates these levels upon trend direction changes, ensuring current market volatility influences all risk calculations and maintains appropriate risk-reward ratios throughout trade management.
Comprehensive Market Analysis Dashboard
The sophisticated dashboard provides real-time market analysis including volatility measurements, institutional activity assessment, and multi-timeframe trend evaluation across five-minute through four-hour periods. This comprehensive market context assists traders in selecting appropriate operational modes based on current market characteristics rather than relying exclusively on historical performance data.
The multi-timeframe analysis ensures mode selection considers broader market context beyond the primary trading timeframe, improving overall strategic alignment and reducing conflicts between different temporal market perspectives. The dashboard displays market state classification, volatility percentages, institutional activity levels, current trading session information, and trend pressure indicators with professional formatting and clear visual hierarchy.
Enhanced Trading Assistants
The Fresh Algo V24 includes specialized trading assistant features that complement the primary signal generation system. The Reversal Dot functionality identifies potential reversal points through Wave Trend Oscillator analysis, displaying visual indicators when crossover conditions occur at extreme levels. These reversal indicators provide early warning signals for potential trend changes before they appear in the primary signal system.
The Dynamic Take Profit Labels feature automatically identifies optimal profit-taking opportunities through RSI threshold analysis, marking potential exit points at multiple levels for long positions and corresponding levels for short positions. This automated profit management system helps traders optimize exit timing without requiring constant manual monitoring of technical indicators.
Advanced Alert System
The comprehensive alert system accommodates all operational modes while providing granular notification control for various signal types and risk management events. Traders can configure separate alerts for normal buy signals, strong buy signals, normal sell signals, strong sell signals, stop loss triggers, and individual take profit target achievements.
Cloud crossover alerts notify traders when trend direction changes occur, providing early indication of potential strategy adjustments. The alert system includes detailed trade setup information, timeframe data, and relevant entry and exit levels, ensuring traders receive complete context for informed decision-making without requiring constant chart monitoring.
Technical Foundation Architecture
The Fresh Algo V24 combines multiple proven technical analysis components including Wave Trend Oscillator for momentum assessment, Supertrend for directional bias determination, Squeeze Momentum for volatility analysis, and various exponential moving averages for trend confirmation. Each component contributes specific market insights while the unified system provides comprehensive market evaluation through their mathematical integration.
The multi-component approach reduces dependency on individual indicator limitations while leveraging the analytical strengths of each technical tool. This creates a robust analytical framework capable of adapting to diverse market conditions through appropriate mode selection and parameter optimization, ensuring consistent performance across varying market environments.
Market State Classification
The indicator incorporates advanced market state classification through ADX analysis, distinguishing between trending, ranging, and transitional market conditions. This classification system automatically adjusts signal sensitivity and filtering parameters based on current market characteristics, optimizing performance for prevailing conditions rather than applying static analytical approaches.
The volatility measurement system calculates current market activity levels as percentages, providing quantitative assessment of market energy and helping traders select appropriate operational modes. Institutional activity detection through volume analysis ensures signal generation aligns with professional market participation patterns.
Implementation Strategy Considerations
Successful implementation requires careful matching of operational modes to prevailing market conditions and individual trading objectives. Trending modes demonstrate optimal performance during directional markets with sustained momentum characteristics, while contrarian modes excel during range-bound or overextended market conditions where reversal probability increases.
The cloud filter configurations provide varying degrees of confirmation strength, with smoother settings reducing false signal occurrence at the expense of some responsiveness to price changes. Traders must balance signal quality against signal frequency based on their risk tolerance and available trading time, utilizing the comprehensive customization options to optimize performance for their specific requirements.
Multi-Timeframe Integration
The system provides seamless multi-timeframe analysis through the integrated dashboard, displaying trend alignment across multiple time horizons from five-minute through four-hour periods. This analysis helps traders understand broader market context and avoid conflicts between different temporal perspectives that could compromise trade outcomes.
Session analysis identifies current trading session characteristics, providing context for expected market behavior patterns and helping traders adjust their approach based on typical session volatility and participation levels. This geographic market awareness enhances strategic decision-making and improves timing for trade execution.
Advanced Visualization Features
The indicator includes sophisticated visualization capabilities through gradient candle coloring based on MACD analysis, providing immediate visual feedback on momentum strength and direction. This enhancement allows rapid market assessment without requiring detailed indicator analysis, improving efficiency for traders managing multiple instruments simultaneously.
The cloud visualization system uses color-coded fill areas to clearly indicate trend direction and strength, with automatic adaptation to selected operational modes. This visual clarity reduces analytical complexity while maintaining comprehensive market information display through professional chart presentation.
Performance Optimization Framework
The Fresh Algo V24 incorporates performance optimization features including signal strength classification, automatic parameter adjustment based on market conditions, and dynamic filtering that adapts to current volatility levels. These optimizations ensure consistent performance across varying market environments while maintaining signal quality standards.
The system automatically adjusts sensitivity levels based on selected operational modes, ensuring appropriate responsiveness for different trading approaches. This adaptive framework reduces the need for manual parameter adjustments while maintaining optimal performance characteristics for each operational configuration.
Conclusion
The Mutanabby_AI Fresh Algo V24 represents a comprehensive solution for professional trading analysis, combining multiple analytical approaches with advanced visualization and risk management capabilities. The system's strength lies in its adaptive multi-mode design and sophisticated filtering mechanisms, providing traders with versatile tools for various market conditions and trading styles.
Success with this system requires understanding the relationship between different operational modes and their optimal application scenarios. The comprehensive dashboard and alert system provide essential market context and trade management support, enabling systematic approach to market analysis while maintaining flexibility for individual trading preferences.
The indicator's sophisticated architecture and extensive customization options make it suitable for traders at all experience levels, from those seeking systematic signal generation to advanced practitioners requiring comprehensive market analysis tools. The multi-timeframe integration and adaptive filtering ensure consistent performance across diverse market conditions while providing clear guidelines for strategic implementation.

OMU_CJ CombinedThis script is a custom technical analysis tool designed for TradingView, built on Pine Script v6.
It combines multiple indicators and logic to provide clear buy and sell signals, optimized for intraday and swing trading.
The strategy includes dynamic trend detection, volatility filters, and adjustable parameters for better adaptability to different market conditions.
Traders can use it to identify potential entry and exit points with improved accuracy.
Key Features:
Multi-indicator signal confirmation
Adjustable settings for different timeframes
Visual buy/sell markers on the chart
Works on all major asset classes (stocks, crypto, forex, indices)
Optimized for both short-term and long-term trading strategies
Disclaimer:
This script is for educational purposes only and should not be considered as financial advice. Always do your own research before trading.
